With the Q3 2017 earnings season well underway, we thought we’d check in on natural gas hedging positions for a handful of E&Ps that have already released earnings. The analysis below utilizes our HedgeAware platform, which covers 40 E&Ps, to examine hedging positions as of the end of the Q3 2017 (September 30, 2017). Stay tuned for an an article on oil hedges.
Hedges are a true forward-looking indicator and HedgeAware’s robust and detailed coverage of hedging positions enables a peek into the future of the US oil and gas industry. Knowledge of active hedging positions, when combined with HedgeAware’s historical data sets, such as past hedging performance, realized price data, production volumes, key financial metrics, and market price data, allows users to anticipate the efficacy of hedging programs and their potential impact on a company’s bottom line. This impact can drive changes in capital spending, cash flow, profitability, and drilling and completion activity. HedgeAware combines disparate data sets into an intuitive, interactive tool that encourages exploration and drill-down to suit your specific scope and drive discovery of truly unique insights.
Hedge Aware is updated frequently throughout the earnings season to keep up with data releases.
Q3 2017 Performance Overview
The natural gas hedging positions of Cabot (COG), EQT Corporation (EQT), QEP Resources (QEP), Range Resources (RRC), and Southwestern Energy (SWN) will be detailed shortly, but first an operational and financial update. The combined natural gas production of these five E&Ps, pictured below, rose from 7.65 bcf/d (billion cubic feet per day) in Q2 2017 to 7.78 bcf/d in Q3 2017.
Figure 1. Natural Gas Production for Selected Companies (mcf/d)
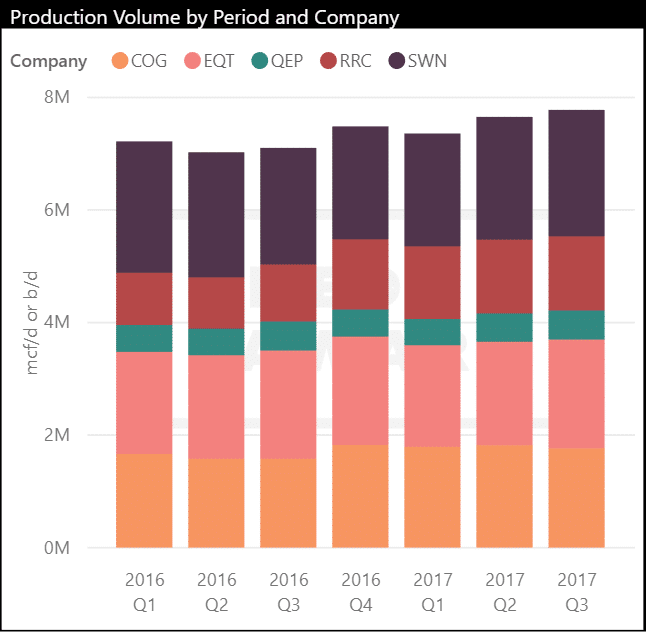
Source: HedgeAware
The five companies minus QEP, which received a one-time boost from the sale of assets, each reported negative FCF (free cash flow), as shown below. The group recorded aggregate FCF of -$316 million, a drop from the previous quarter’s -$241 million. Cabot posted negative FCF for the first time in 6 quarters. It should also be added that QEP, not pictured below, recorded positive FCF for the quarter with the impact of its asset sale included, but negative FCF when that contribution is removed.
Figure 2. Free Cash Flow for Selected Companies
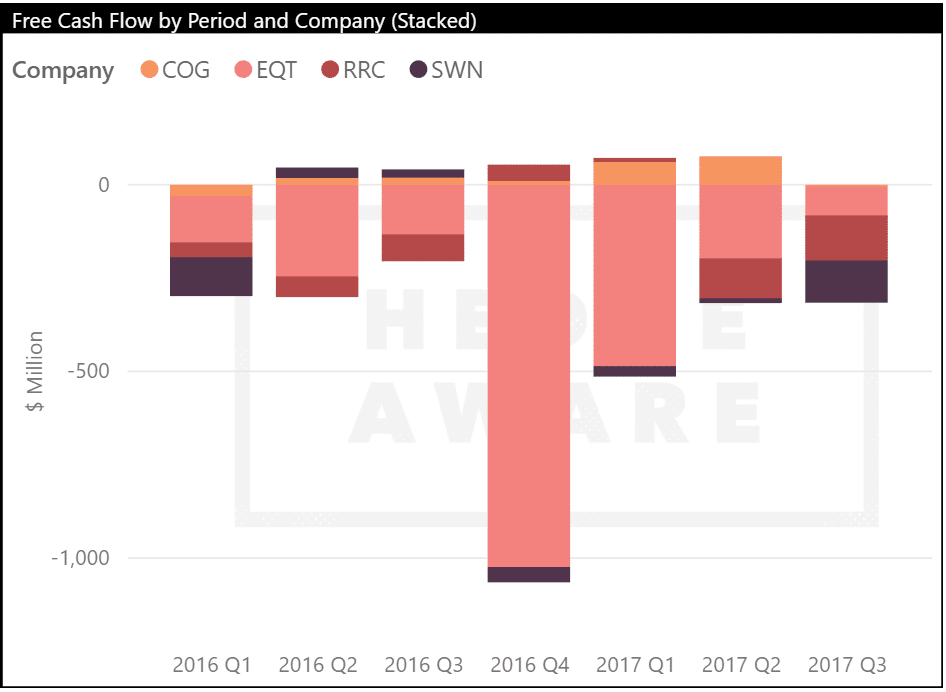
Source: HedgeAware
Declining revenue and slightly increased CAPEX both contributed to the deteriorating cash flow position of these four companies in Q3 2017.
Figure 3. Revenue and CAPEX for Selected Companies
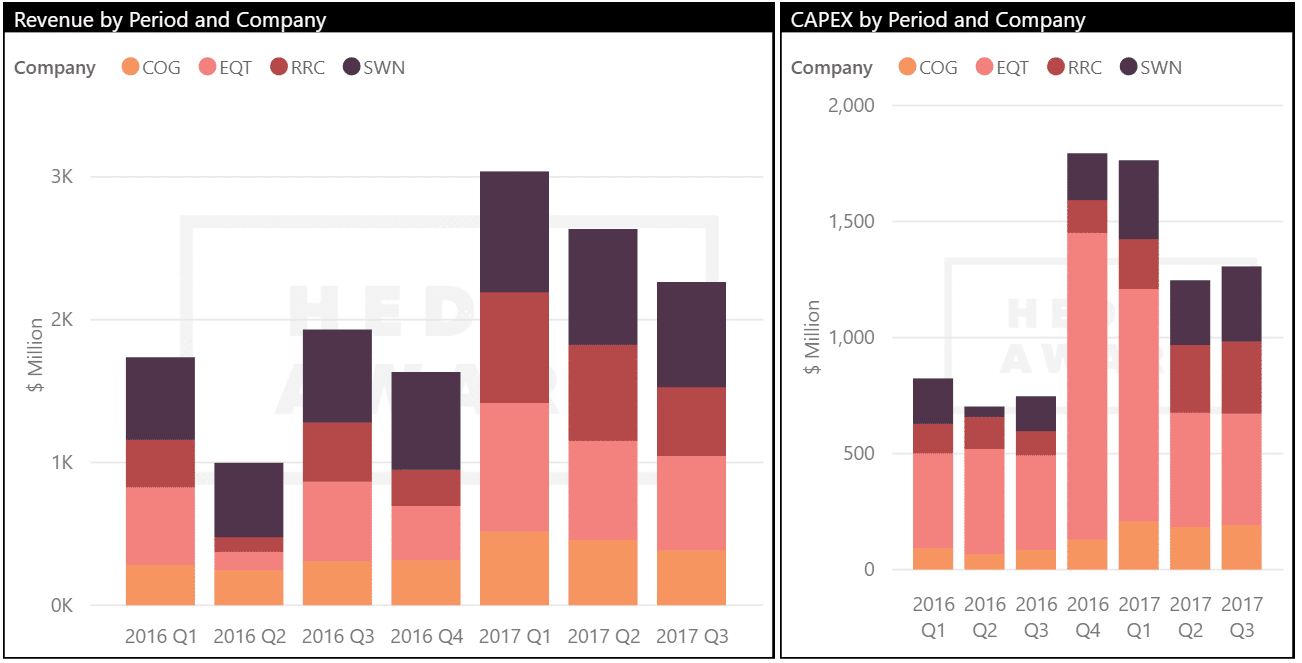
Source: HedgeAware
A significant factor behind the revenue drop is the decoupling between realized sales prices (green line includes derivative impact, black line excludes derivative impact) and Henry Hub prices (red line), driven by widening differentials between regional indices and Henry Hub starting in the winter of 2016/2017. These discounts more than offset the effects of increased natural gas production growth seen over the past two quarters. Natural gas hedges, such as fixed price swaps and collars, are financial derivatives and generally tied to the price of Henry Hub. Therefore, they will not protect against regional pricing discrepancies for physical delivery. This is where basis differential swaps come into play. QEP and SWN have been employing basis swaps in recent quarters but they were not sufficient to fully protect from pricing discounts Henry Hub. Note, however, that derivatives provided a positive impact on realized prices for these five companies as a whole for the first time since Q4 2016.
Figure 4. Realized Natural Gas Sales Prices vs Henry Hub
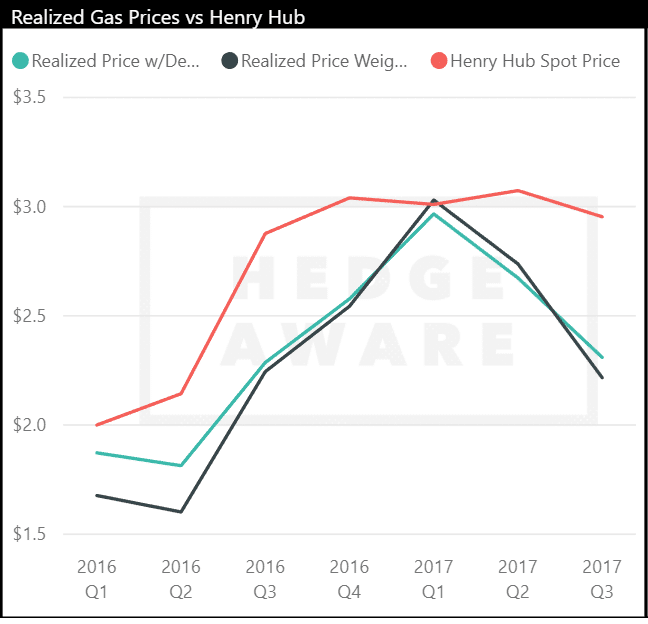
Source: HedgeAware
The following chart shows the derivative impact on realized natural gas sales prices by quarter for each company, where reported. Hedging performance declined nearly in lockstep with natural gas prices as they rose from $2/mcf to over $3/mcf during the course of 2016. Some companies that had been layering on hedges in late 2015 and early 2016 soon found their hedges underpriced as natural gas broke $3/mcf in late 2016.
Figure 5. Impact of Hedging on Realized Natural Gas Prices
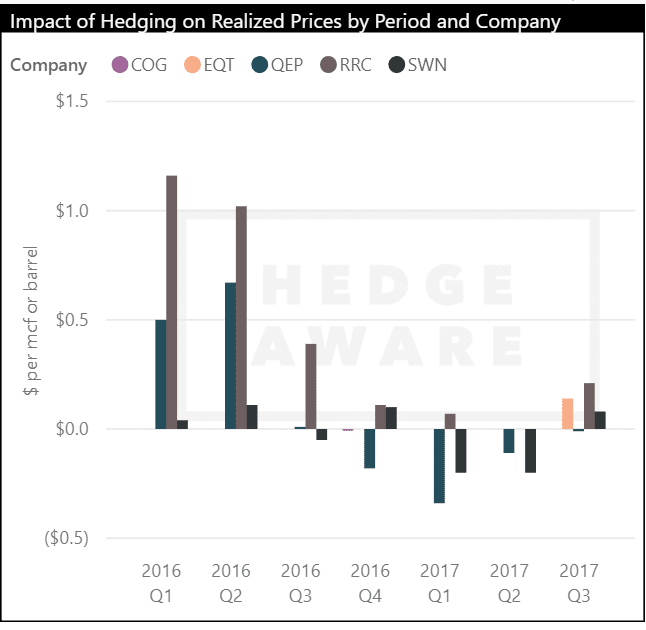
Source: HedgeAware
The ability to hedge was complicated as the natural gas forward curve narrowed in late 2016 and early 2017, meaning E&Ps would have to lock-in lower prices for future production relative to prevailing prices as compared to in past quarters.
Figure 6. Henry Hub Futures Spread
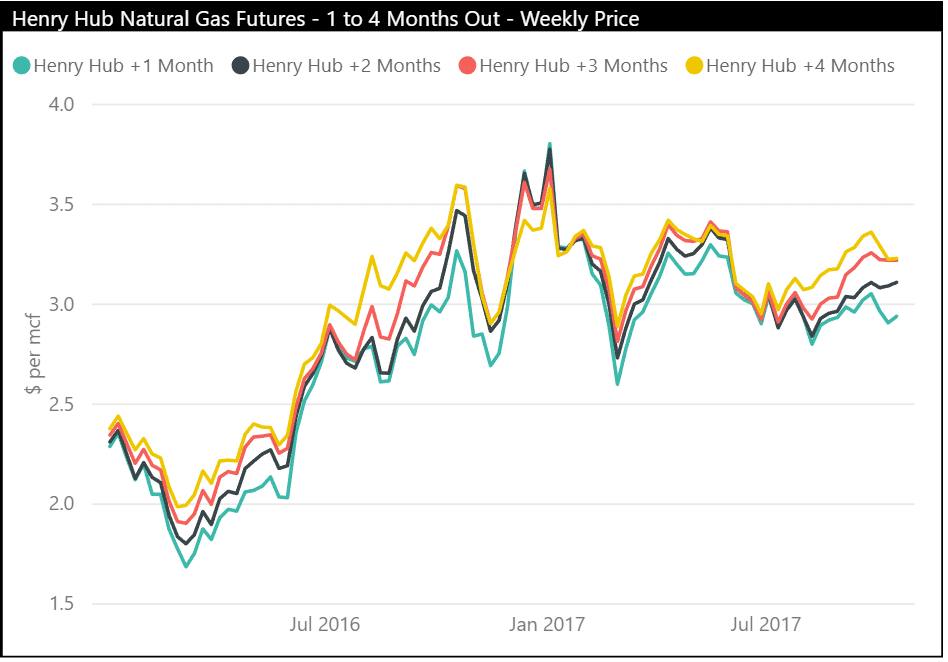
Source: HedgeAware, EIA Data
Natural Gas Hedging in Q4 and Beyond
Enough about the past, let’s look at future. COG, EQT, QEP, RRC, and SWN have combined swap volumes of 3.5 bcf/d at a weighted average price of $3.19/mcf for Q4 2017. This price is generally based upon the Henry Hub price is sometimes tied to other indices. The five companies also have a tad over 1 bcf/d of collars for Q4 2017, with an average ceiling of $3.48/mcf and a floor of $3.03/mcf. Both hedging positions are providing a positive financial impact at the moment, excluding premiums, given current Henry Hub price of about $2.90/mcf.
Figure 7. Swap and Collar Positions for Selected Companies
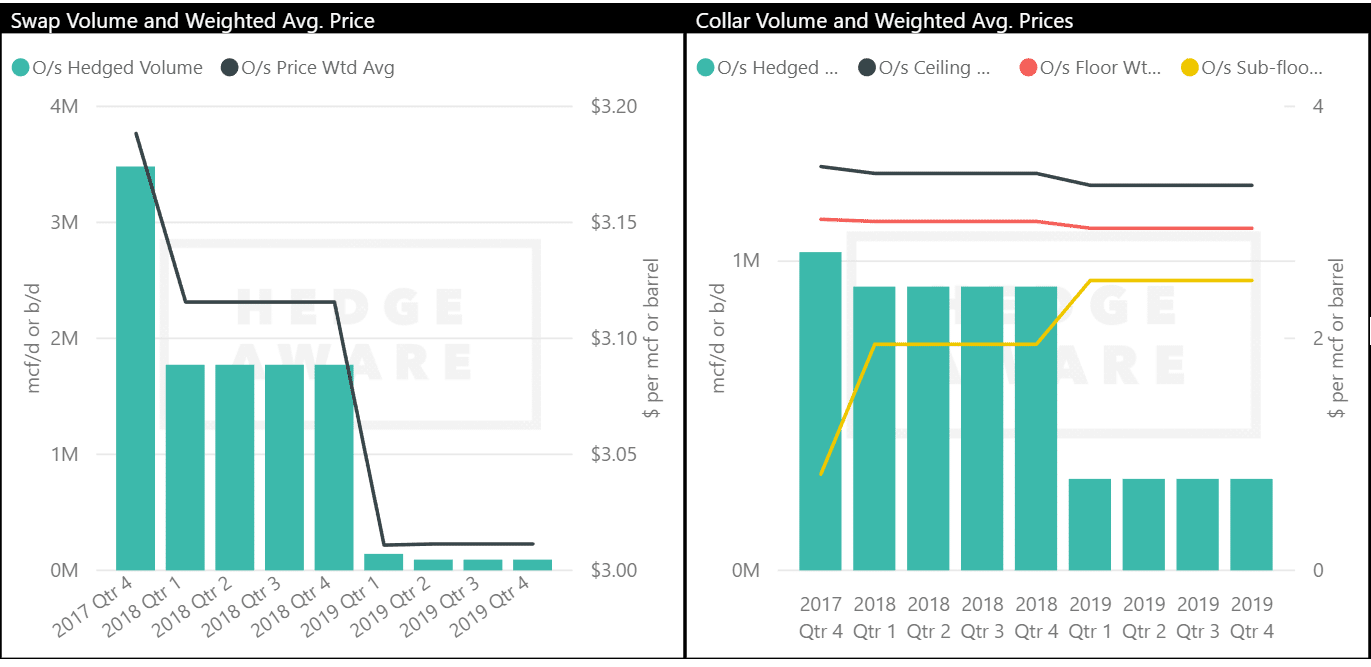
Source: HedgeAware
Current hedging positions compare favorably to the past several quarters in which QEP and SWN, most notably, had fixed price swaps and collar floors slightly below the price of Henry Hub, leading to a hedging loss on a per unit basis, as detailed earlier in figure 5. In addition to the swaps and collars pictured above, EQT, RRC, and SWN also employ options strategies as a hedging mechanism (pictured below). SWN sold significant volumes of call options through 2020 at or above $3.50/mcf. EQT and RRC have simultaneously sold calls and purchased puts, effectively creating an unbalanced collar with a ceiling and floor.
Figure 8. Option Positions for Selected Companies
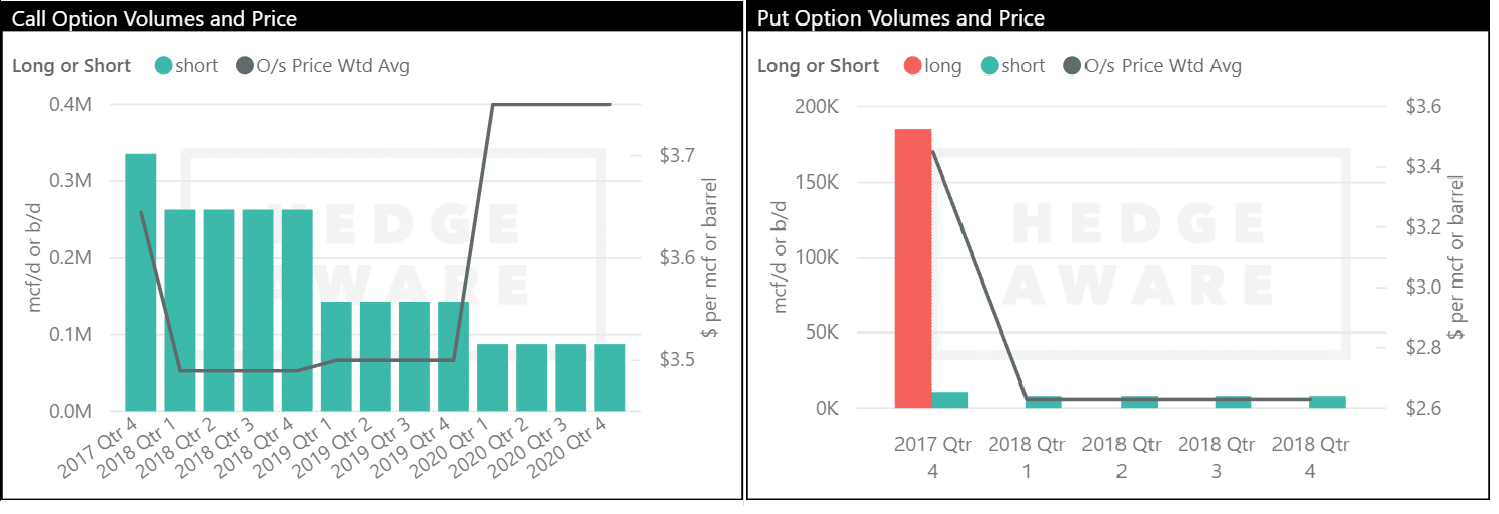
Source: HedgeAware
In all, the five producers covered here have natural gas hedges in place equivalent to 65% of Q3 2017 production volumes for Q4 2017 (via swaps, collars, and options). This is at the high end of the range going back to 2016 for prompt quarter hedges, but falls just short of hedge levels at the end of Q1 2017, a quarter in which these five companies had hedged 71% of Q1 production levels for Q2 2017. Bear in mind that hedges generated a negative financial impact in Q2 2017, so this is not necessarily a bad thing.
Figure 9. Hedged Share of Natural Gas Production by Quarter
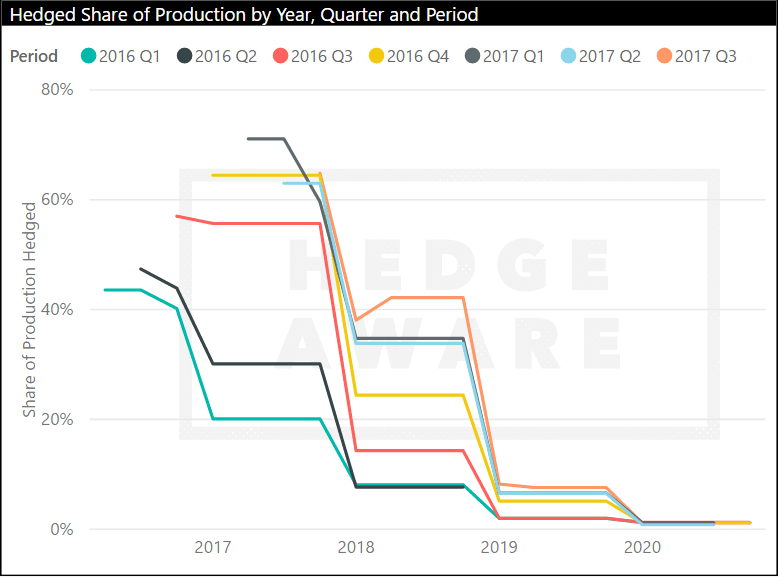
Source: HedgeAware
Conclusion
The five E&Ps discussed in this article are well hedged on the gas side for Q4 2017. Weighted average swap prices are approximately 10% above the current Henry Hub price and collar floors 5% above Henry Hub. Absent a significant and prolonged rise in Henry Hub prices (it is winter, so you never know), expect these derivatives to have a positive financial impact for Q4 2017. And with nearly two-thirds of production volumes hedged, these positions will provide a stable and robust pricing environment for these operators in Q4 2017 (financial gain is not the only reason to hedge, the ability to create a stable pricing environment within which one can plan and operate is quite valuable as well). But hedging programs are not without risk and a rising Henry Hub price would begin to expose those risks. Using HedgeAware, one can quickly assess how changes in price will affect hedging performance and, ultimately, financial performance and activity levels.